PLOT FUNCTIONS OF TWO VARIABLES
1. Start 3DField and double-click on Function plot tree item in Map Manager windows
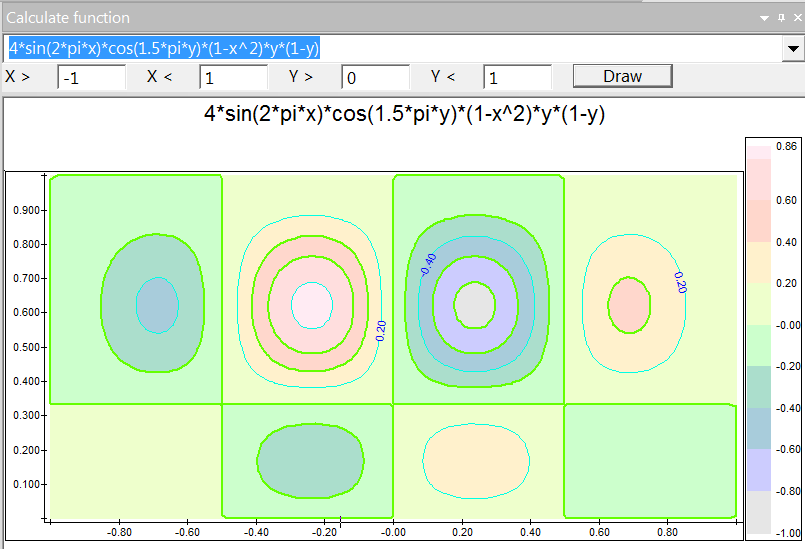
2. Enter the function. You can use:
+;-;*;/;^;%;&;!;>;>=;<;<=;!=;==;pi;
abs();acos();asin();atan();avg();bin();cell();cos();cosh();fact();
floor();hex();if();isNaN();log();log10();max();min();rand();round();
sin();sinh();sqrt();sum();tan();tanh()
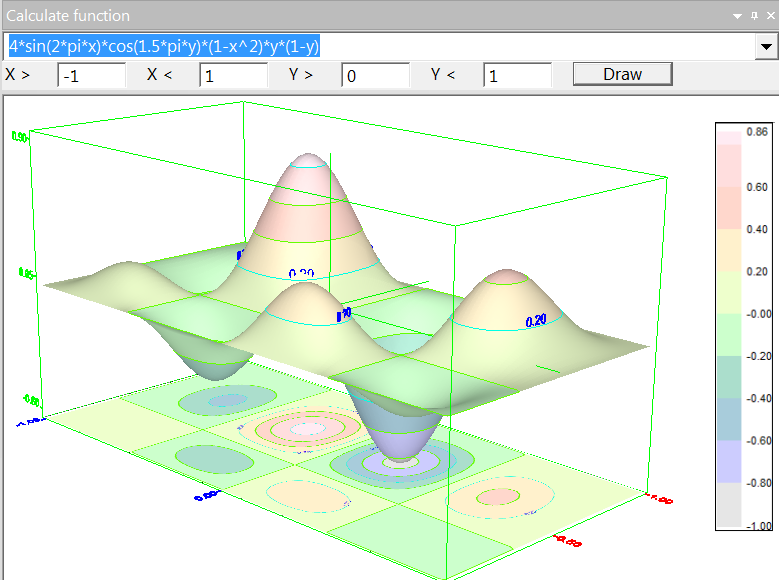
Enter the limits for variables and click Draw button.
+;-;*;/;^;%;&;!;>;>=;<;<=;!=;==;pi;
abs();acos();asin();atan();avg();bin();cell();cos();cosh();fact();
floor();hex();if();isNaN();log();log10();max();min();rand();round();
sin();sinh();sqrt();sum();tan();tanh()
Enter the limits for variables and click Draw button.